
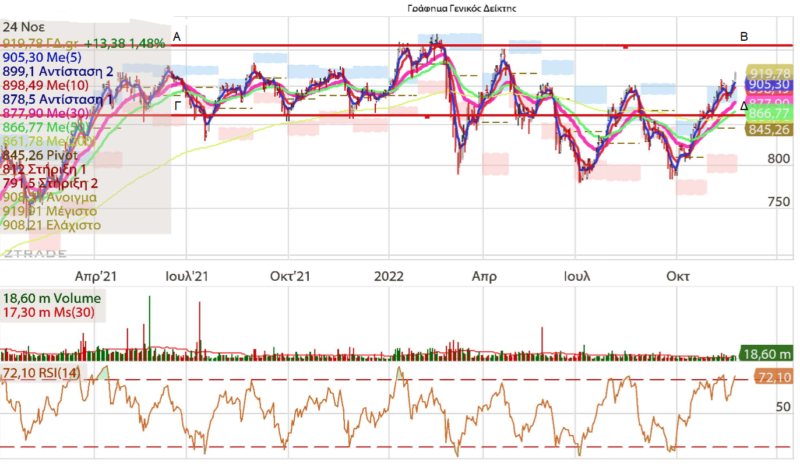
The fifth consecutive session recorded gains for the Greek Stock Exchange, as the general index closed at 919.78 points, up 1.48%. Transaction value was formed in 54,69 million euros with a value of parcels amounting to 3,21 million euros, while of the shares traded today, 72 top closed, 38 refuses and 57 remained unchanged.
The general index traded on positive ground throughout the session, recording the highest level during the session at 919.91 points shortly before closing, as the ratio of bullish/bearing stocks was 1.9 to 1.
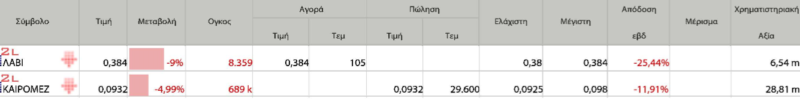
Biggest ups / biggest downs


meeting packages

Nine months financial results Yalko
52-week high/low

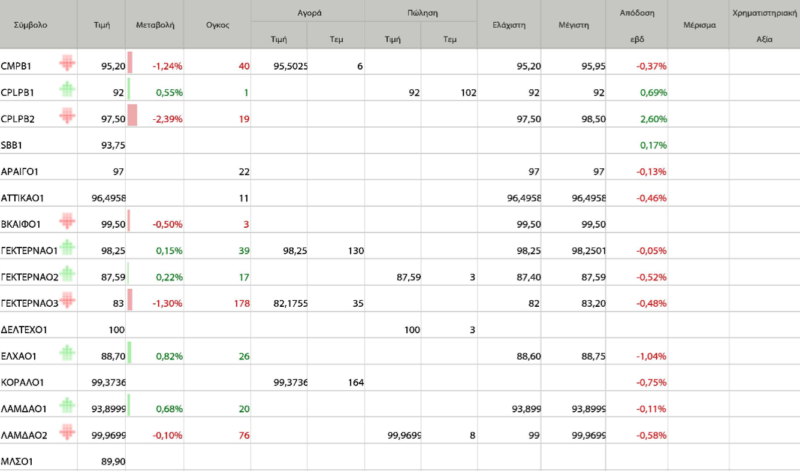
Corporate bonds

In global stock markets, on the daily chart The indexeς Dow Jones, Standard & Poor’s 500. And the Nasdaq They negotiate With a strong buy signal. in Europe, And the The indexeDaxAnd the FTSE 100, mrh CAC 40 They negotiate with a strong buy signal, as shown in the table below. The New York Stock Exchange will be closed today for a holiday.

It maintains its upward trend General indexAnd the Finished above the overbought area today, with The market signal ReminderAnd the And the with tumor formation higher from an average of thirty days. The resistance Located in 958,0 units (line AB), and h support for 860,0 units (GD line). The size is set to 18,60 million units vs 17,30 1 million units from the 30-day average.
Closed with a positive sign and pointers large capital, Finished above the overbought area market signal to be preservedAnd the And the With the resistor set to 2.330 units (line A)and support on 1.972 units (DG line).

Closed with profits And the The Indicators from the middle of the cap, Finished above the borders of the overbought area, after stabilizing above From KMO200 on (1,366 units), with The market signal to me remainsAnd the with the Resistance would be at 1,441 units (line A)And the to her Support is at 1135 units (DG line).

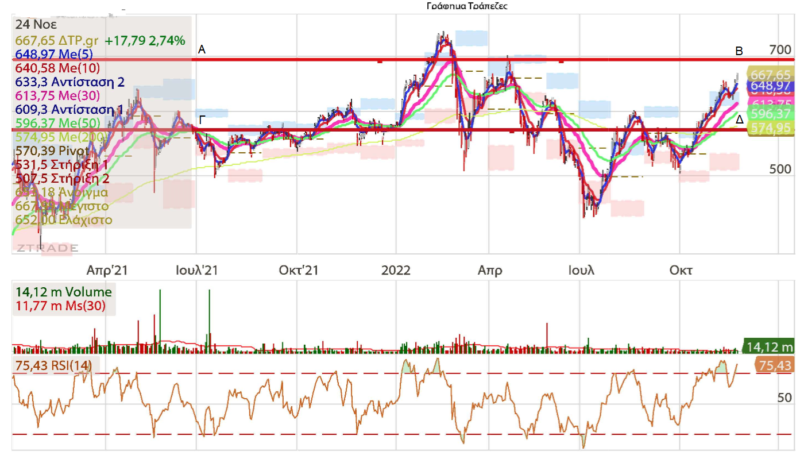
Thursday profit day for him Banking services Indicator, stay for the second consecutive session above the overbought threshold; with The market signal to me It is preservedAnd with it resistance to be present in 694 units (line AB), f Support at 569 units (GD line). The the sound has been formed in 14,12 million units vs 11,77 1 million units from the 30-day average.
Inventory From OPAP It closed at 13.14 EUR, an increase of 1.55%, continuing efforts to move to higher levels.And the with Signal shopping to me remains. The resistance is located in 13,86 euroAnd the and the the support in 12,80 euro with next At a price of 11.29 euroswith the eKstreams in stock for are increasing. MO volume 30 days is 465.0 thousand pieces.
Return of the month + 5.54%
3-month yield -3.38%
6 months return + 7.66%
Yield of 1/1 + 12.32%
52-week return +11.69%
The maximum rate is 52 weeks. 13,95 euro
The minimum rate is 52 weeks. 10.9951 euro
Net position: 734.9 million. EUR (Financial data nine months 2022)
BV 1.92
P/BV 6,83
s/eIt was completed 13And the54
EV/EBITDA* 7,20 (based on 12 months)
net borrowing /EBITDA* 0,42 (based on 12 months)
Free cash flow: €347.0m in the nine-month period of 2022 from €241.2m in the corresponding period of 2021.
Foreigners / own 0.40,000
sUmar Farooq +38,89%
Solvency ratio 42.56%
Leverage ratio * 29.50%
Capital: 4.73 billion euros
its stock He has closed at 3.13 EUR, an increase of 1.29%, New effort to move to higher levelsAnd the with Signal a discount to me It is preserved. The resistance is found in 3.22 eurosAnd the The support for 2,98 Euro, with postagehe isIn stock flows to increase appear. The volume of MO 30 days is 43.7 thousand pieces.
Return of the month -1.11%
3-month yield -8.48%
6-month yield -15.41%
Yield from 1/1 – 15.63%
52-week return -15.41%
The maximum rate is 52 weeks. 409 euro
The minimum rate is 52 weeks. 2,94 euro
Equity: 101.3 million euros (9-month financial statements 2022)
BV 1,75
P/BV 1.79
s/eIt was completed 15th,42
EV/EBITDA* 9,49 (based on 12 months)
net borrowing /EBITDA* Negation (based on 12 months)
Free cash flow: €5.3m in the nine-month period of 2022 from €9.1m in the corresponding period of 2021.
Alien / private negatively
sUmar Farooq +8,07%
The solvency ratio is 31.94%
Leverage ratio* is negative
Capital: 188.9 million euros
its stock Champions It closed at €1.37 with an increase of 3.79%, maintaining its short-term bullish trend as well as a buy signal. The resistance is found in 1,38 euro With the following at 1.56 eurosAnd the The the support in 1,21 eurowith mailhe isstreams in stock for Keep going. The volume of MO 30 days is 23.4 thousand pieces.
Monthly Return + 7.45%
3 months return +9.60%
6 months return +19.13%
Yield of 1/1 + 10.93%
52-week return +7.03%
The maximum rate is 52 weeks. 1,39 euro
The minimum rate is 52 weeks. 1,03 euro
Equity: 27.3 million euros (Financial data for the first half of the year 2022)
BV 1,25
P/BV 1,10
P/E.It was completed 5,0
EV/EBITDA* 3,40 (based on 12 months)
net borrowing /EBITDA* 1,29 (based on 12 months)
Free cash flow: 8.9 million euros in the fiscal year of the first half of 2022, from 945,844 euros in the corresponding period of 2021.
Alien / private 0,67
sUmar Farooq +11,43%
Solvency ratio * 24.45%
Leverage ratio * 40.14%
Capital: 30.02 million euros
*solvency ratio It is the company’s ability to handle its financial obligations, especially in the long term. The higher this ratio, the greater the company’s ability to meet its obligations.
* EV / EBITDA: This ratio is used to determine a company’s value based on EBITDA (earnings before tax, interest, and depreciation). The higher the EV/EBITDA ratio, the more the company is overvalued, while the lower it is, the more undervalued it is (less than 8x).
* Net Debt / EBITDA: This ratio shows the number of years it would take a company to pay off its debt if net debt and EBITDA remained constant. It also takes into account the company’s ability to reduce its debt. This ratio, usually when it is higher than 4, is considered a warning, because the company is less likely to be able to manage its debt, and therefore less likely to take on the additional debt required for its development.
* Leverage factor: Net debt (including rents) / Total capital employed (net debt + equity).
Greek government bond yields declined, with the five-year yield at 3.125%, down 2.24%, and the ten-year yield at 4.064%, down 0.47%.

Theodoros Simertzidis, CEFA

what mentioned before expression Personal opinions, and in no way constitute a solicitation to buy, sell or hold any securities.
Follow us on Twitter:
https://twitter.com/neweconomygr
https://twitter.com/TheodorosSem

“Avid problem solver. Extreme social media junkie. Beer buff. Coffee guru. Internet geek. Travel ninja.”


More Stories
Labor Inspectorate: What applies to Easter gift for workers in the private sector
DYPA: 1,000 jobs opened
Away from this car…